Search Engine Marketing for Hotels

SHARE:

AUDIENCE TARGETING AND ITS INTRODUCTION TO SEARCH ENGINE MARKETING: As advertisers, we have the option to add specific audience targeting to paid search marketing campaigns. Google’s audience targeting was originally only available on display networks and YouTube campaigns, but in May 2017, Google expanded audience targeting to its paid search ad network. For advertisers in the hospitality industry, the in-market audience targeting options include demographics, such as age and gender.

AUDIENCE TARGETING FOR HOSPITALITY PPC: Age plays a vital part in marketing for the hotel and hospitality industry. The legal age to book a hotel room in the U.S. is 18 years old, but many hotels have the option to limit the booking age to guests who are 21 years and older. When evaluating previous traffic and booking behavior, we noticed a higher ratio of spending to revenue in people under the age of 25. Based on this information, we decided to focus our audience targeting for men and women above the age of 24. Currently, there are two different options for including audience targeting for hotels:

  • Focusing on specific demographics
  • Remarketing to the hotel’s returning guests

We focus on a few different types of remarketing. One type of remarketing is website targeting, which delivers ads to people who previously visited your website. Another form of remarketing through Google AdWords is audience retargeting to the hotel’s email distribution list. This is called Google AdWords Customer Match and includes any customer who stayed at the hotel or signed up for a newsletter. Targeting an audience that focuses on specific demographics requires an extensive knowledge of the property and the demographic groups that have the highest conversion rates. Google Analytics will track the conversions and separate each demographic group, based on age, gender, income, or location. Based on the information that we gathered for this hotel, we determined it would be most effective to target age demographics for our audiences.

THE LENOX HOTEL RESULTS: Our team at GCommerce Solutions ran a test for using audience demographic targeting within PPC campaigns for The Lenox Hotel in the Back Bay area of Boston. We completed the following bid adjustments:

  • Added negative bid adjustments of 90% to their audiences that had the lowest conversion rates (18-24 year-olds not searching for Name Terms)
  • Added positive bid adjustments of 25% to their audiences that had the highest conversion rates (45-54 and 55-65).

Our study includes data from June 11, 2017- July 20, 2017, compared to July 21, 2017-August 29, 2017. With changes in demographic targeting, we were able to better control our budget with a 5% decrease in cost per click and 7% decrease in total cost, while capturing a 4% increase in revenue for the property. The results of this test conclude that utilizing age/ demographic bid adjustments is a more accurate way to target the most qualified audience for this hotel, and allows us to increase our overall Return On Ad Spend. GCommerce recommends tracking data at the audience level to understand performance before implementing any bid adjustments. Specific adjustments and test parameters should be unique for your hotel, based on historical data. Please contact us if you have any questions about audience targeting and how you can better utilize this feature to improve performance.

Ready to increase your direct revenue and returns-on-ad-spend? Great! Click the button below and get started today.

Hotel & Digital Marketing Analytics | Water Business Analytics

SHARE:

Psychology experts have estimated that having something like a communal water cooler will increase workplace productivity by as much as 10-15%. Experts at GCommerce will tell you it’s a huge pain when the communal water cooler stops working. Which is exactly what happened last week at our offices in Park City. It took just over 2 days for it to be fixed and in that time we used 2.5-gallon jugs as replacements. Our Reporting and Analytics specialists are always looking for new ways to measure data and we saw this as a great opportunity for some water cooler insights. While this information probably does not benefit our business in any way, we thought it would be interesting to measure out our drinking water usage in an exercise very similar to building insights for hotel websites. Here, we’d like to share our results with you:

We bought 2 different types of water, Spring Water and Drinking Water, both from Mount Olympus. We contacted the wonderful people at Mount Olympus Water for comment, they explained: “the difference between the 2 is that Spring Water is from a locally sourced spring with a natural mixture of minerals that give the water a pH balance between 6.5 and 8. Drinking Water is purified from a locally sourced tap with natural minerals added that give the water a pH of exactly 6.” The representative that commented for us said that he personally preferred the Drinking Water to the Mineral Water. I was unable to determine any difference in a blind taste test.

Table 1

Screen-Shot-2017-09-22-at-11.02.45-AM-1

As Table 1 illustrates, GCommerce employees also prefer the Drinking Water to the Spring Water, nearly 2:1. A full Drinking Water jug unopened has about 7.5 inches of water in it. The Drinking Water jug that was not fully consumed had about .4 of an inch of water left in it. Therefore, we could estimate about .2 of a gallon of water were left, or 2.3 gallons consumed. With 1 Spring Water and 1 Drinking Water empty, that gave a total consumption of 4.8 gallons of Drinking Water and 2.5 of Spring Water.

Considering this is only about half the water the office consumed, as only 1 water cooler went out, we could double these numbers and make predictions about our office drinking habits. Assuming there are 5 days in a normal workweek, we will drink about 29 gallons of water, with 22 workdays in an average month, we will drink close to 129 gallons and with 262 workdays in an average year, we will drink over 1,530 gallons of water.

Table 2

Screen-Shot-2017-09-22-at-11.03.04-AM


If that sounds like a lot of water, it sort of is. Each gallon of water is enough to take up 7.5 cubic feet of water in a swimming pool. Which means we could completely fill a pool of over 204 cubic feet with the amount of water we drink each year. Although, as an Olympic sized swimming pool is over 88,000 cubic feet, it would take us over 441 years to drink enough water to fill a pool of that size.

At this point, you might be asking yourself, why does this matter? The short answer is, it probably doesn’t, but we thought it would be interesting. What does matter are the insights that we can learn and the strategy that can be developed by tracking data. Knowing that your office of 40 people drinks enough water each year to fill a kids-size inflatable swimming pool might not help your business at all. But accurately tracking user interactions across multiple advertising platforms to build a deeper understanding of your website visitors, bring more revenue to your business while maximizing your Return On Advertising Spend is important.

Whether it’s your website’s business analytics in the office during the week or water cooler data on the weekend, your Analytics and Reporting specialists at GCommerce are passionate about accurate data and reporting insights for hotels. Contact us today to see how we can help support your website analytics.

POTENTIAL CHANGES TO GOOGLE ANALYTICS ARE LOOMING

SHARE:

% OF NEW SESSIONS MISSING | CHANGES TO GOOGLE ANALYTICS METRICS

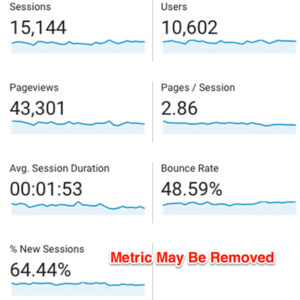
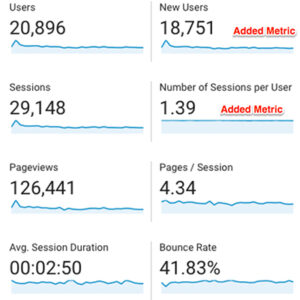
For users of Google’s Premium Analytics services, you may have noticed a slight change in the way that default metrics are being displayed. Google has removed the % New Sessions, added in Number of Sessions per User and New Users. They have also re-ordered the metrics to show Users and New Users ahead of Sessions.

CURRENT VIEW, SESSIONS FIRST:

2017.04_Blog_Image_Copy_Left_2_AnalyticChanges

NEW VIEW, USERS FIRST:

2017.04_Blog_Image_Copy_Right_1_AnalyticChanges

CURRENT VIEW, SESSIONS FIRST:

chart

NEW VIEW, USERS FIRST:

2017.04_Blog_Image_Copy_Bottom_2_AnalyticChanges

% New Sessions can still be viewed in Custom Reports, Dashboards, and Segments or as a Secondary Dimension on most reports within Google Analytics.

We were unable to find any documentation from Google that they are updating the default views in Analytics. Representatives from Google Analytics would not confirm nor deny any changes, however, a support specialist was able to share over the phone that Google has internal documentation showing that this change is rolling out to all Google Analytics accounts over the next few months. This representative let us know that Google is moving to a focus centered more around Users, rather than Sessions, which is reflected in these updates.

Just last week, Google made an announcement that they would be extending Remarketing List Audiences across devices. They have also made numerous changes over the last few years in the way that ads can be remarketed. It seems that the move to a stronger focus on Users in Google Analytics is an effort to better track and target individual users with ads through Google’s Ad services across all devices, through multiple platforms and channels.

If Google is rolling out other changes with this one, it is yet to be seen. However, we expect Google to continue to advance their tracking, reporting, and advertising to be more user and audience focused with greater opportunities to remarket and segment individual users across devices and through multiple channels within Google’s extensive advertising network.

KEEP READING